6. Data Visualization
When you want to plot a single variable for a single time slice, xarray’s built-in plotting methods are more than sufficient.
nd provides a few extra methods for visualizing multi-temporal and multivariate datasets.
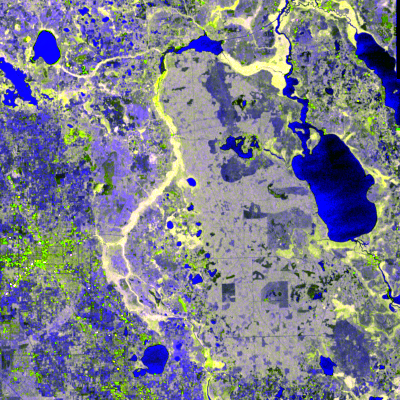
6.1. Creating RGB composites from multivariate data
>>> from nd.io import open_dataset
>>> from nd.visualize import to_rgb
>>> ds = open_dataset('data/C2.nc')
>>> t0 = ds.isel(time=0)
>>> rgb = to_rgb([t0.C11, t0.C22, t0.C11 / t0.C22], 'images/c2_rgb.png')
6.2. Creating video from time series data
The example writes to a gif image so it can be embedded here, but many video formats are supported.
>>> from nd.visualize import write_video
>>> write_video(ds, 'images/c2.gif', fps=5, timestamp=False)
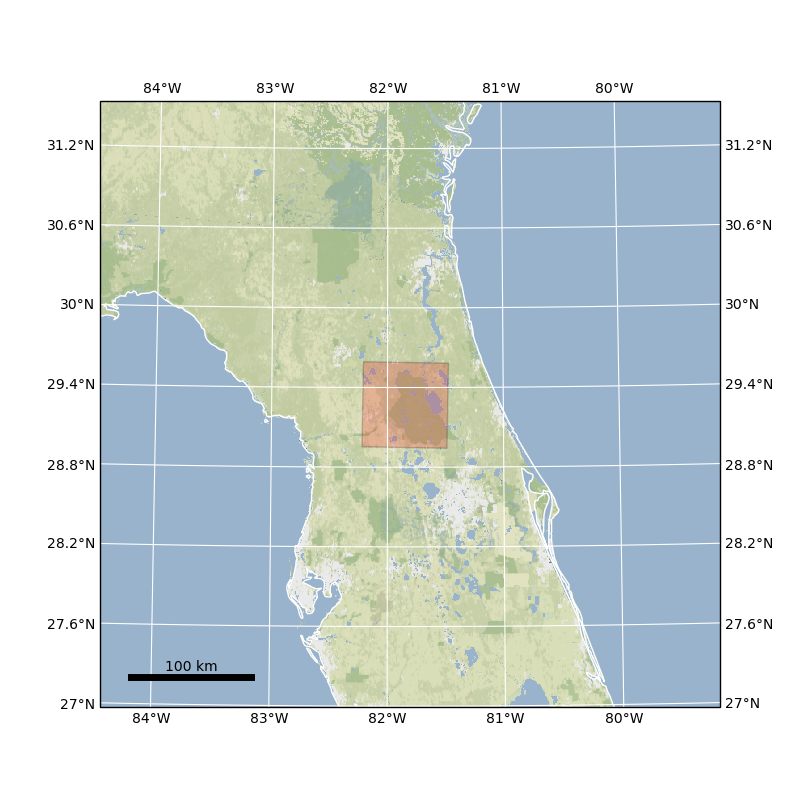
6.3. Creating a map
>>> from nd.visualize import plot_map
>>> import matplotlib.pyplot as plt
>>> plt.figure()
>>> plot_map(ds, buffer=6, imscale=11)